- The Borrow Smart Chronicles
- Posts
- 2026 - Setting Up to be 'Amazing'
2026 - Setting Up to be 'Amazing'
If you are flexible, and focused, the wind should be at your back!

Todd Ballenger
January 12, 2026

"Step into the new year like a quiet investor in yourself—patient, optimistic, and willing to compound small, courageous choices into something extraordinary.”"
IMPORTANT NOTE:
In 2026, I will send the Newsletter on Mondays. It gives me the weekend to work on a topic of interest. I will release my favorite charts of the week on Friday, so now you’ll hear from me twice a week. I hope that’s okay…
Please let me know what you’d like me to explore further. You can email me at [email protected].
a BORROW SMART CONCEPT
Why 2026 Looks Good to Me?
Fewer Loan Officers. More Production.
That’s the Shift.
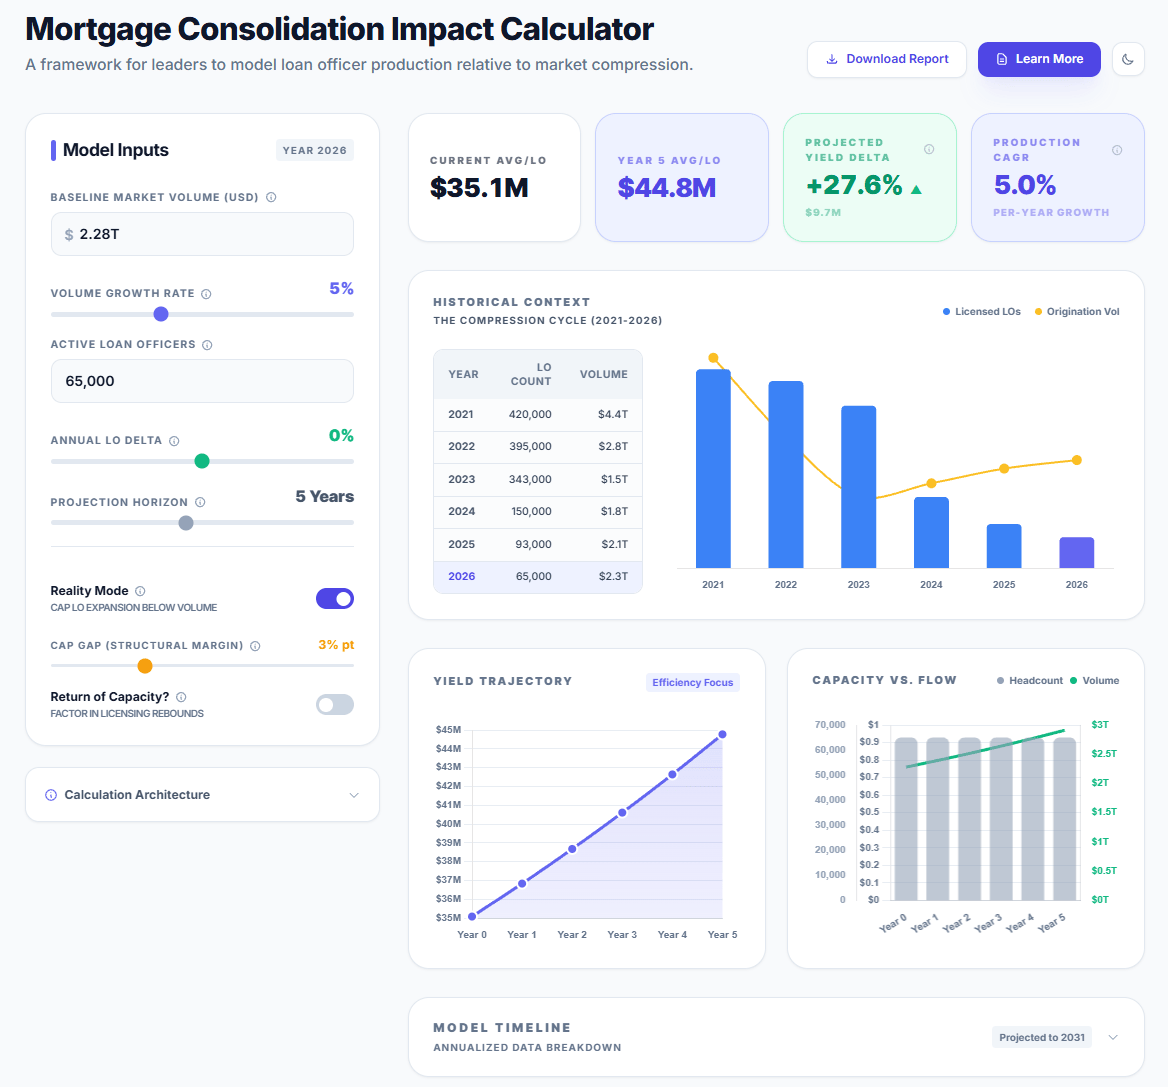
This chart tells a story most people miss at first glance. Every January, we publish a presentation to our partners on the critical headwind. This year, I’m sharing it with you as a live dashboard.
From 2021 to 2026, the number of licensed residential loan officers collapses — from roughly 420,000 to ~65,000. At the same time, total mortgage origination volume stabilizes and begins to recover, moving from ~$1.5T back toward ~$2.3T.
That means one thing:
Average production per loan officer is heading UP (meaningfully).
What’s actually happening
In 2021, $4.44T spread across ~420K LOs = ~$10.6M per LO
By 2026, ~$2.28T spread across ~65K LOs = ~$35M per LO
That’s more than a 3× increase in per-officer production in just five years.
This isn’t a temporary anomaly. It’s a structural shift:
Fewer, more professional operators
Better tech leverage
Higher client concentration
Less “tourist” capacity in the industry
What happens next if volume only grows 5% per year?
Here’s the non-obvious insight.
Even if total mortgage volume only grows at 5% annually, average production keeps rising sharply — because capacity doesn’t come back the way people expect.
Assume:
Loan officer count stays flat (or grows very slowly)
Volume grows at just 5% per year
Simple math (directionally correct):
Year 0: $2.28T ÷ 65K ≈ $35M per LO
Year 5: $2.28T × 1.28 ≈ $2.9T total volume
$2.9T ÷ 65K ≈ $44–45M per LO
That’s another 25–30% increase in per-officer production — without a boom, without refis, and without rate miracles.
The takeaway most people are missing…
This is not a “when rates drop” story.
This is a power-law industry reset:
The middle hollowed out
The top got stronger
Average productivity permanently stepped up
In the next cycle, success won’t come from doing more loans —
it will come from controlling better decisions, better advice, and better leverage per client.
The era of the $10–15M LO is over.
The era of the $40–50M LO is just getting started.
Key Borrow Smart Concept - It’s a Marathon, not a Race
Everything compounds… out live out last.
Click the image to view an interact - this is updated every January

Was this email forwarded to you? Sign up here.