- The Borrow Smart Chronicles
- Posts
- Do House Values Always Go UP?
Do House Values Always Go UP?
a 75 Year history reviewed and dissected...

Todd Ballenger
December 26, 2025

"Don’t wait to buy real estate.
Buy real estate and wait."
I hope all of you survived and thrived in 2025. I feel 2026 is going to be such a fantastic year in our history - a convergence of lower rates and pent-up demands for housing with the promises (and challenges) of AI terraforming all that we know to be true about work and being human. In my 59 years on the planet, 32 of them directly involved in lending, investing, and real estate (the 3-Sided Balance Sheet) - I’ve never been so optimistic.
Keep the charts and graphs to a minimum this week, with a simple write-up on the last 75 years in real estate as a driver of wealth through appreciation.
a BORROW SMART CONCEPT
Do House Prices Always Go Up?
Do Home Prices Really Always Go Up?
A 75-Year Reality Check
For decades, homeowners, realtors, and even some financial advisors have repeated a simple line: “Real estate always goes up.” It’s comforting. It feels true. And looking at long-term horizons, it mostly is.
But “mostly true” is a dangerous way to make financial decisions.
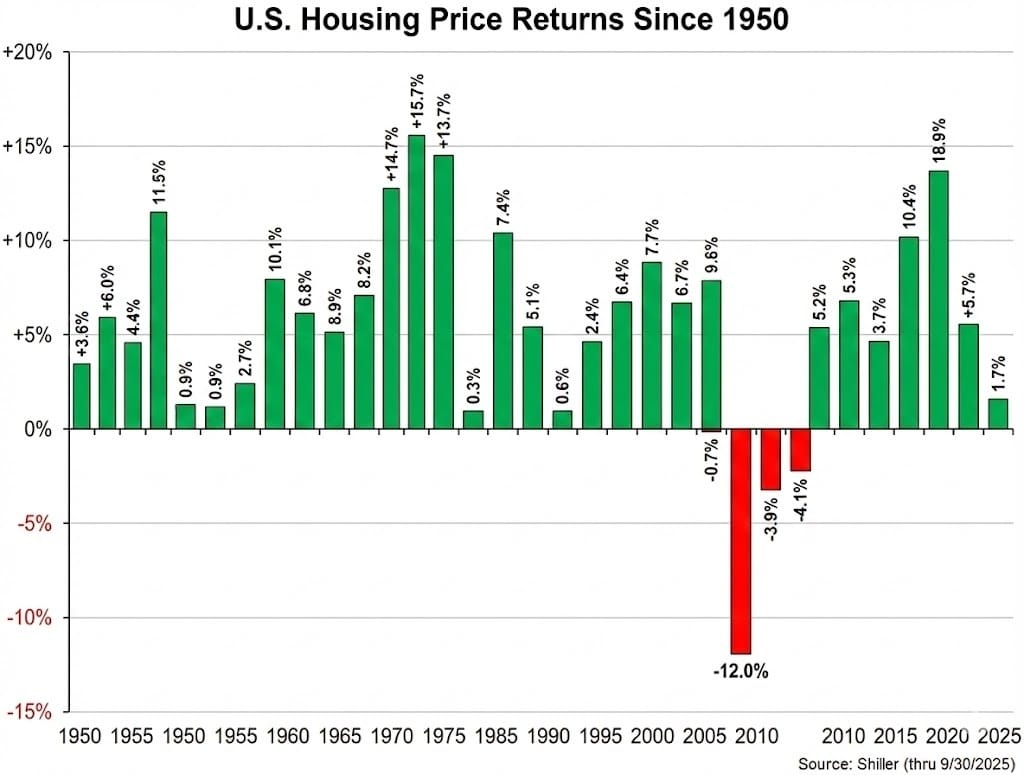
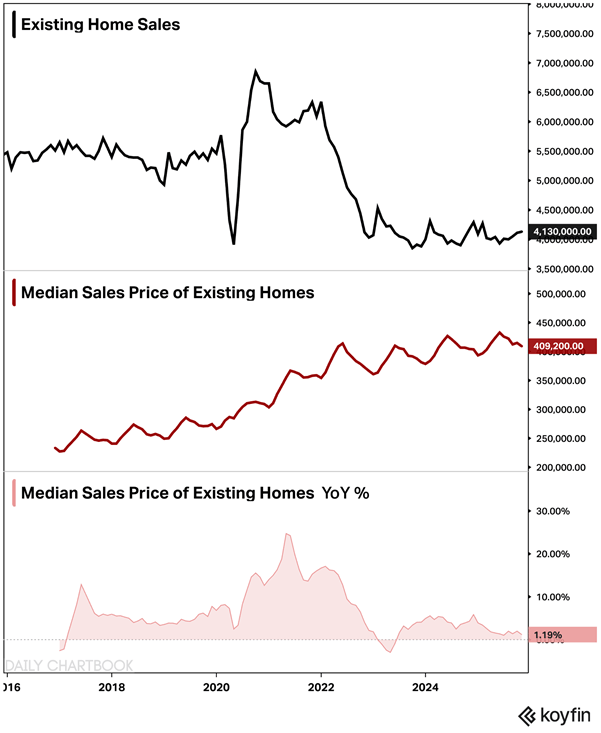
If you study the whole history of U.S. housing returns — especially the Shiller data shown in the chart above — a more accurate statement emerges:
Let’s unpack what this 75-year chart tells us, and more importantly, what it means for buyers, sellers, and anyone thinking about wealth-building through real estate.
1. The Big Picture: 1950–2025 Housing Returns
Over the last seven decades, U.S. home prices have primarily delivered positive annual returns — often in the +3% to +10% range. That consistency is part of what made real estate the backbone of American wealth.
But the chart immediately reveals two crucial truths:
Truth #1 — Price growth is not smooth.
There are quiet stretches (+0.3%, +0.6%) and explosive ones (+15.7%, +18.9%).
Truth #2 — Negative years do happen, and some are brutal.
The 2007–2011 housing crisis shows:
–0.7%
–3.9%
–12.0%
–4.1%
That’s not volatility — that’s a wipeout.
Understanding these cycles is essential for anyone making decisions based on timing, equity, or affordability.
2. The Most Persistent Myth: “Housing Never Falls”
Many people believe real estate is uniquely stable. But the data says otherwise:
Home prices can and do fall.
They fall in clusters, not one-off events.
They fall harder when leverage is highest, and lending standards are loosest.
And because housing is a slow-moving asset (sellers postpone listing, builders delay projects, appraisals lag), declines last longer than in stock markets.
The 2006–2011 episode shows a multi-year unwinding — not a quick correction.
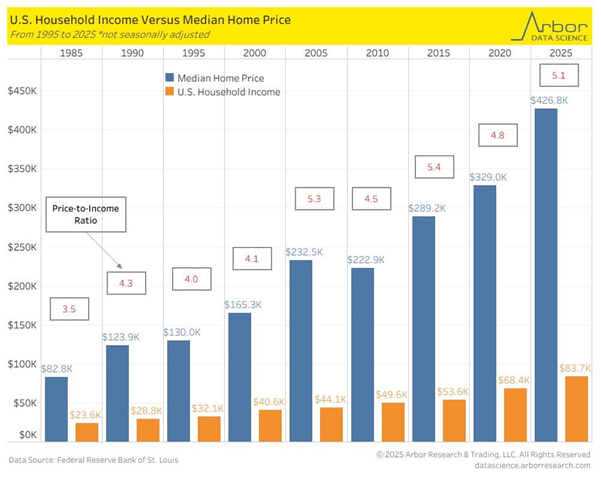
3. The Real Driver of Long-term Price Growth: Inflation + Scarcity
A key insight:
Most of the long-term upward trend in home prices is not explosive appreciation — it’s simply inflation + land scarcity + labor/material costs.
That means housing is less like a tech stock and more like a slow, steady inflation hedge with occasional storms.
4. Why Recent Years Look So Strong (But Are Also Fragile)
The chart shows powerful returns in the 2010s and 2020s:
Post-2008 rebuild (+5.2%, +3.7%, +5.3%, etc.)
Pandemic surge (+10.4%, +18.9%)
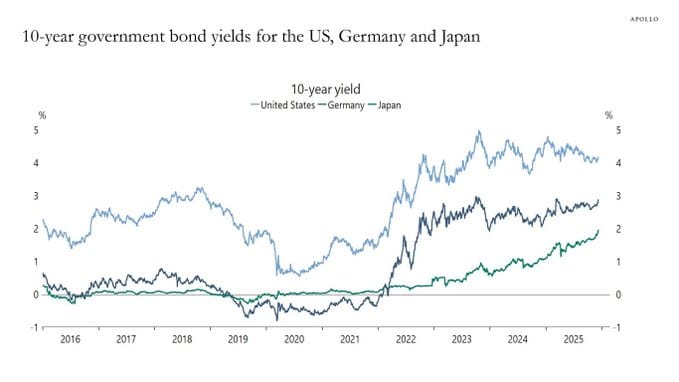
These returns weren’t random. Three forces drove them:
Ultra-low mortgage rates (sub-3%)
Post-pandemic supply shortages
Institutional investor activity in single-family homes
Here’s the catch:
When prices rise because rates fall, those gains are sensitive.
When rates reverse, affordability collapses — and prices eventually respond.
We’re already seeing early signs of that pressure today.
5. So… Do Home Prices Always Go Up?
This is a more accurate mindset:

6. What This Means If You’re Thinking About Buying
1. Buy for life fit, not for market timing.
Trying to perfectly time housing cycles is a fool’s game. Buy when your life, finances, and timeline align.
2. Your holding period matters more than your entry price.
Historically, the risk of loss drops dramatically after 7–10 years.
3. Leverage amplifies both gains and losses.
This is why mortgage strategy (rate, term, liquidity planning) matters as much as the home itself.
4. Don’t assume past returns guarantee future returns.
Near–zero interest rates fueled the 2020–2022 boom. That may not repeat.
5. Real estate works best when paired with disciplined liability planning.
This chart supports one of the most critical lessons in wealth-building:
Your liability strategy is just as crucial as your asset strategy.
7. The Bottom Line: Housing Is a Great Wealth Builder — If You Respect the Cycles
The chart tells a balanced, honest story:
Housing is historically reliable.
Housing is not invincible.
Cycles matter.
Rate environments matter.
Holding periods matter.
Liquidity and leverage matter even more.
Real estate is still one of the most powerful tools for building wealth in America.
But like all powerful tools, it works best when handled with clarity, humility, and a plan.
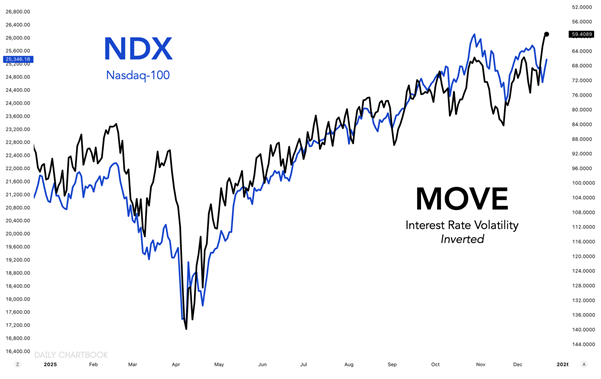
LIABILITIES
What’s Happening?


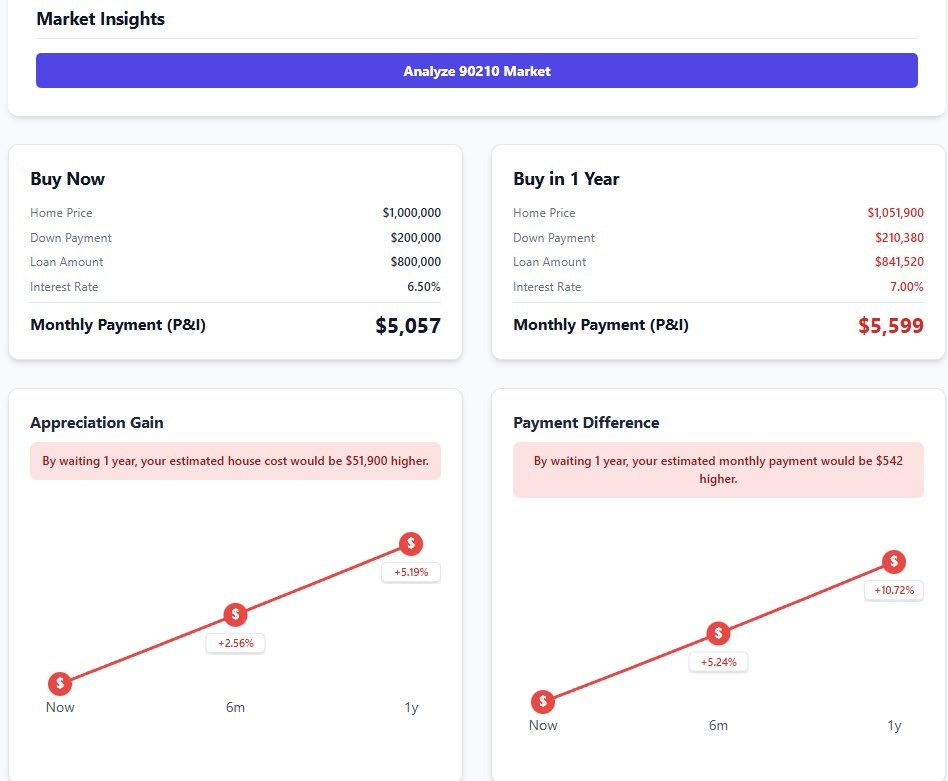
See our simple consumer version of the Cost of Waiting calculator:
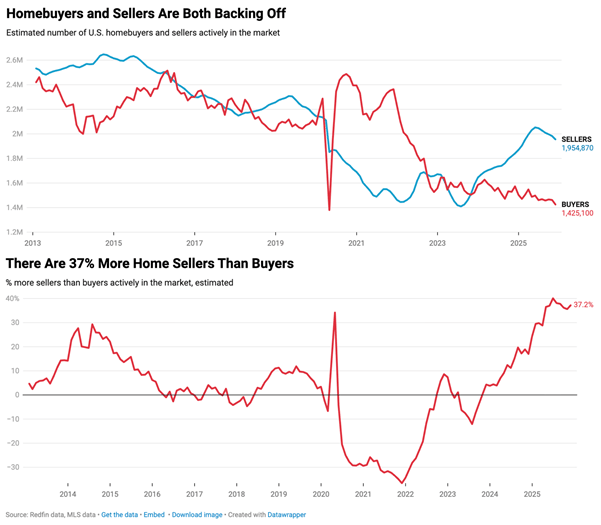
REAL ESTATE
What’s Happening?

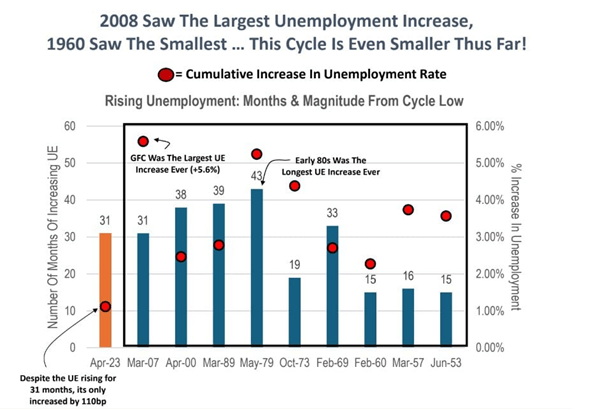
ASSETS
What’s Happening?


ON BEING HUMAN
What’s Worth Sharing?

When you see something that isn’t AI, and it moves you, the human world becomes more precious. - photo by Andrey Pavlov - a Russian nature photographer focused on the lives of ants!
DOPAMEMES
And Other Happy Moments…
This goes out to my dad, who loves Roy Clark and Johnny Cash:
Was this email forwarded to you? Sign up here.